Learn how both the y-intercept and the slope describe motion on a position–time graph.
The y-intercept shows the car’s starting position when time = 0.
The slope shows the car’s velocity (how fast and in which direction it moves).
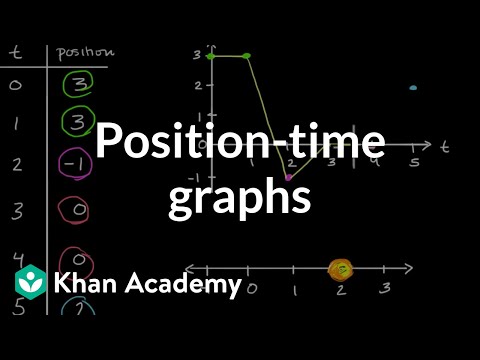
Watch the Khan Academy video "Position–time graphs" and review motion graph concepts.
Read a motion description for the LEGO car, then sketch your prediction of its position–time graph.
Visit the Getting Started page and prepare your workspace.
Roll your Observe™ LEGO Car on your desk to match several position–time graph challenges in Desmos
that involve both starting position and slope.
Write clear descriptions of the motion for each challenge in the Activity 4 online worksheet.
Getting Ready:
Graphs help us describe both where motion starts and how it changes over time.
On a position–time graph:
• The y-intercept shows the car’s starting position when time = 0.
• The slope shows the car’s velocity, which includes both speed and direction.
• A steeper slope means the car is moving faster.
• A positive slope means the car is moving forward.
• A negative slope means the car is moving backward.
• A flat line (slope = 0) means the car is stopped.
To review these ideas, watch this Khan Academy video:
×
Click this review of
position–time graph concepts to check your understanding before starting.
What Do You Think?
Open the
LEGO Car Activity 4 Worksheet
in a new tab of your browser. Make a copy in your Google Drive, then return to this page.
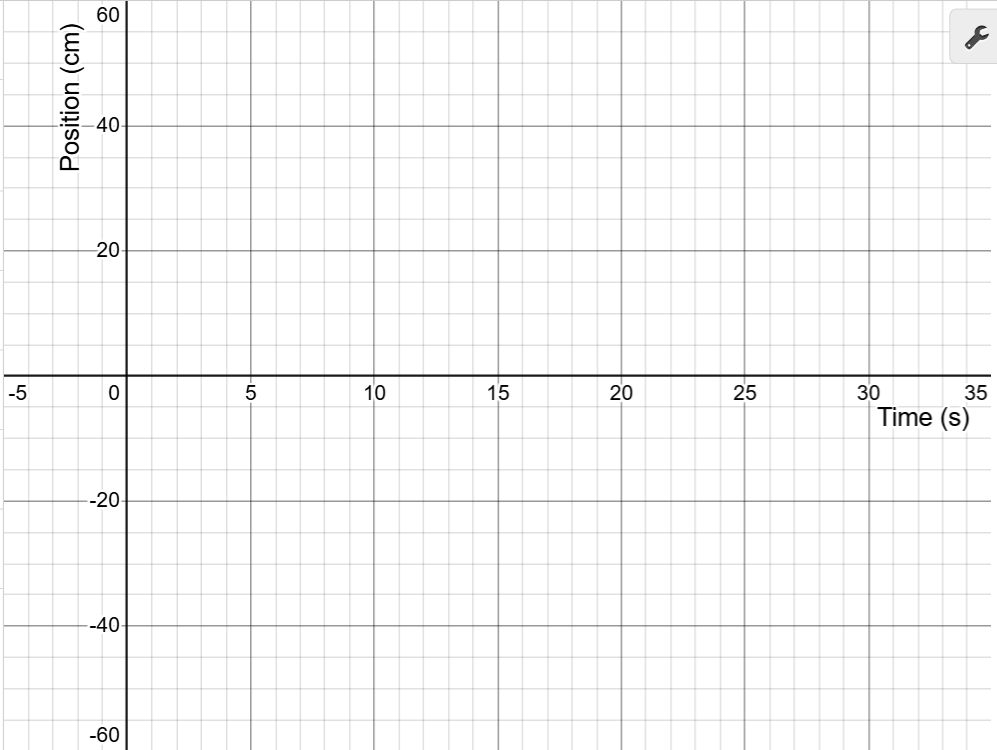
On the graph below, sketch your prediction of the LEGO car’s motion.
The car starts at the origin, reaches 50 cm at 10 s, remains there for 10 s,
and then returns to the origin by 30 s.
Use your mouse to click and drag on the graph to draw your prediction.
If you need to start over, click Erase Drawing.
When you are satisfied, click Capture Drawing to copy the image to the clipboard
and paste it into the Activity 4 worksheet.
Measuring Your Data:
Review the Getting Started guide to set up your workspace and pair your LEGO car.
Scroll until the entire graph is visible. Notice that the car’s position (the red point) updates on the graph in real time.
Smoothly roll your car back and forth on the number line until the red point matches the graph’s starting position (y-intercept) on the y-axis.
This is your initial position for matching the graph.
To begin collecting measurements in your Desmos data table, click the Start Collection button below.
Roll your car smoothly to follow the shape of the blue position–time line displayed in the Desmos graph.
Focus on matching both the starting position (y-intercept) and the slope (speed and direction) of each segment of the line.
Repeat a few times until you are satisfied with the match. Click the Refresh Page button to clear the graph and data.
Turn on your car, select its ID from the dropdown, and reconnect the car.
When finished, click Capture Graph to copy your matched graph to the clipboard. Switch to the Activity 4 worksheet tab and paste the image.